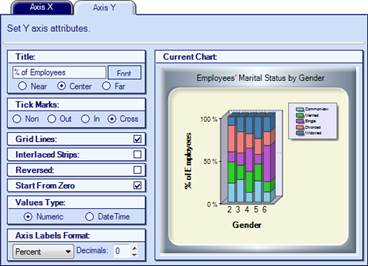
· Under the Axis X and Axis Y tabs, assign formatted axes Titles.
· Choose the placement of Tick Marks for axes values.
· Make Grid Lines visible or invisible.
· Apply Interlacing Strips of gray shading to every other grid column or row.
· Make the chart axes reversed.
· Maintain or eliminate any white space between the charted elements and the edges of the chart area with the Side Margin or Start at Zero option.
· Set the axes Values Type as Numeric or Date/Time.
· Select the correct Axis Labels Formats and the number of Decimals for these values.
