Before specifying criteria for your query, take some time to think about the design of your query by considering the following questions:
· Do you want to search the whole database or just a portion of data (e.g., incident data recorded within a particular time period, person data for employees only)?
· If you want to search a portion of data, what parameters do you want in your search?
· What type of data do you want to see in your query results (e.g., incident time, place, losses)?
· How do you want to present your data? Do you want to summarize your results or see lists of actual data values?
In the example below, we will be looking at a query design with the following specifications:
· Type of query: Incident query.
· Scope of data: Incidents that happened since 2007 and involved net losses (e.g., Net Loss of each incident is above 0.50 cents).
· Data of interest: Number of incidents, Year, Category, Site, Total Loss, and Net Loss.
· Data grouped by: Year, Category, and Site.
OPTION 1a: If you want to search the whole database, proceed to select the specific types of data that you want to see in your query results.
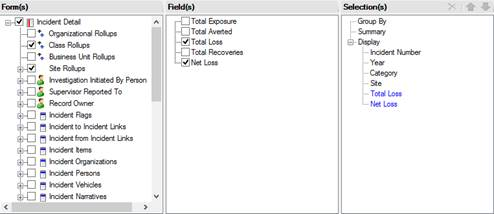
1. Expand the relevant form nodes in the Form(s) pane to see all constituent subforms.
2. To view fields available in a form in the Field(s) pane, click once on the name of the relevant form. To select all the fields in a particular form, check the form box.
3. In the Field(s) pane, check the boxes of the fields you want to see as headers in your query results and reports. The field names will automatically populate the Selection(s) pane under Display in the order they were selected.
· To reorder the fields appearing in your query results, select the field in the Selection(s) pane and then use the up and down arrows in the top right corner of the pane to rearrange the field’s position in the Display list.
· To delete a field from display in your query results, select the field name in the Selection(s) pane and click the Remove icon  in the top right corner of the pane, or uncheck the field’s checkbox in the Field(s) pane.
OPTION 1b: If you want to search a portion of data, set the parameters of your data sample.
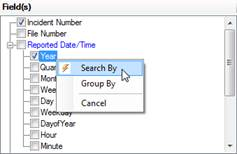
1. In the Field(s) pane, right-click a field that corresponds to the parameter of interest, and select the Search By option from the menu. If you do not want a parameter field to be displayed in the query results, unselect the checkbox beside the field’s name in the Field(s) pane.
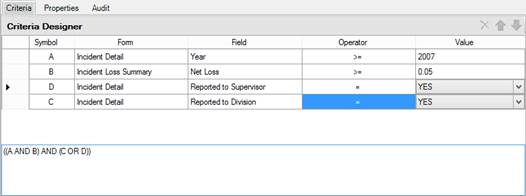
The selected field will now appear in the Criteria Designer pane below.
2. To specify a comparison value for the selected parameter, select the relevant Operator from the lookup list (e.g., =, <>, >, Like, Starts With, Ends With). Depending on the type of parameter, you will have an option of either entering the comparison value in the Value field, or selecting it from the lookup list.
3. Add as many parameters for your data sample as needed.
4. As you continue to specify the parameters, the system will edit the corresponding Boolean logic statement at the bottom of the Criteria Designer pane. By default, Perspective searches for data that meets both criterion A AND criterion B, and so on. If you want to only generate results that meet either criterion A OR criterion B, or some variation thereof, you must modify the statement to reflect this. It is best to modify the statement after you have entered all your data parameters first.
Note: Deleting a parameter symbol (e.g., A, B, C) from the statement will not remove the corresponding parameter from the list. However, if a parameter is deleted from the statement, it will not appear in the executed query results. Ultimately, the Boolean logic statement contains the defining formula for your data sample, while the list of parameters provides the parameters you may search by, and serves as a reference point for the statement.
· To reorder the parameters in the Criteria Designer list, select the corresponding row and use the up and down arrows in the top right corner of the pane to rearrange the parameter’s position in the list.
· To delete a parameter from the list, select the corresponding row and click the Remove icon  in the top right corner of the pane, or uncheck the field’s checkbox in the Field(s) pane.
· To view the text expression of the Boolean logic statement for your data, select the Properties tab of the Criteria Designer pane.
OPTION 2a: If you want to see lists of raw data values in your query results, proceed to execute your query.
OPTION 2b: If you want to see your query results summarized, select the fields by which you would like to group your results.
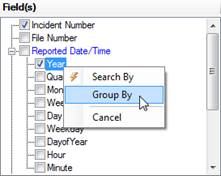
1. To group your query results by a particular field, ensure the field’s box in the Field(s) pane is checked. Then, right-click the field and select Group By from the menu.
Note: Not all fields are available for group by. In order to group by a particular field, it must have only one reference value, i.e., its value cannot be cumulatively derived from several fields. For example, an incident’s Total Loss field cannot be grouped by, since it potentially draws data from multiple involved items and vehicles with recorded losses. In contrast, the Site field in an Incident record can refer to only one site value, which makes it a legitimate candidate for a Group By criterion. Moreover, it is not possible to group by a child data field (e.g., Assigned Date of Incident Investigators).
The Summary function is activated when at least one Group By field is selected. This will reflect in the view of the Selection(s) pane: the selected field name will automatically populate the pane under both Group By and Summary, while the field names that were listed under Display, will all be transferred to the Summary list.
If you delete a field name from the Group By list, all the fields contained under Summary will be transferred back to Display.
Note: If your Display list contains fields from child data (e.g., Incident Investigators’ Assigned Date, Completed Date, or Last Name), selecting a Group By field (e.g., Year) will transfer all the parent data fields to the Summary list and delete all the child data fields.
2. In the query results, the system will perform data calculations on all the fields that appear under Summary. The fields’ actual data values will not appear in the query results (unlike when they were selected for Display); only the products of the specified data calculation for the fields will appear. In order to see the actual data values together with the calculations, you will need to duplicate all the relevant field names under Group By using the Field(s) pane, as described above.
To quickly locate the field names in the Field(s) pane, one by one click on the field names in the Section(s) pane. The system will automatically display the relevant field list in the Field(s) pane. Right-click the field you want to import to the Group By list of the Selection(s) pane and select Group By from the menu.

Some of these calculations are meaningful; for instance, the COUNT for Incident Number will produce counts of Incident records for specific categories by which you chose to group your query results (e.g., Category, Site). Others may refer to unique categorical entries (e.g., DISTINCT COUNT for Site or Year), and will not produce meaningful results, unless you choose to display the actual values of the field (i.e., transfer the field to the Group By list). Therefore, you will need to think very carefully about selecting the right fields for summaries (e.g., sums and averages for losses, counts for items), and leaving the rest as actual values (e.g., names of categories, sites, years).
Note: Once a field appears in both Summary and Group By lists, its calculation node disappears, which means that the system will display the actual value of the field (not a calculation) in the query results.
3. Proceed to save or execute the query.


