The Pie Chart tab, while a different type of chart from the Data Charts tab (with different options to view your results by), allows you to modify how you view your data results. The following section will give you an in-depth understanding of the options you can use in the Pie Chart section of Analyze Results.
1.Click the Show as Data Chart tab.
2. Enter a title for your chart in the Title field.
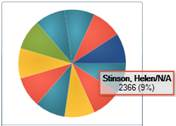
3. If you want to see exact numbers, hover your mouse over the pie chart.
4. You can copy the chart and paste it into a document (e.g., Microsoft Word or Excel). To do this, click the Copy Chart as Image button, open the program that you want to copy the chart to, and paste it. Or, you can save your chart to your desktop by clicking the Save Chart as Image button.
Note: Hide the charting options by clicking the Chart Options button. Bring the options back into view by clicking the button.