Various additional functions are available in crosstabs including:
· Crosstab.Value() returns the content of the cell (as a value).
· Crosstab.Cells.Avg() returns the average value of the volume of data.
· Crosstab.Col$() or Crosstab.Row$() returns the description of the column or the row for the current cell.
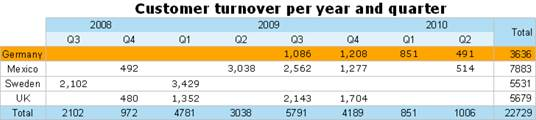
With this, you can, for example, assign a particular color to the background of a column or row. The following example sets the background color to orange for all cells in a row where the cell descriptor is Germany:
Cond(Crosstab.Row$()=Germany,LL.Color.Orange,LL.Color.White)
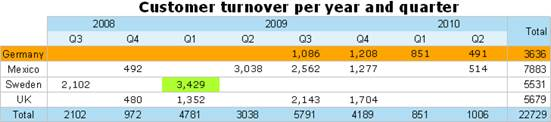
· Crosstab.Cells.Max() or Crosstab.Cells.Min() returns the largest or smallest value in the entire crosstab. With this, you can, for example, emphasize the largest or
smallest value of the volume of data or perform calculations. The following example sets the background color of the cell with the largest value to green:
Cond(Crosstab.Value=Crosstab.Cells.Max(),LL.Color.Green,
Cond(Crosstab.Row$()=Germany,LL.Color.Orange,LL.Color.White))
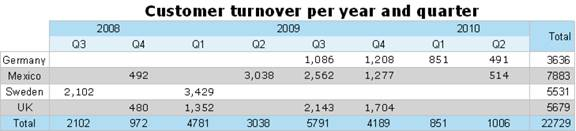
· Crosstab.Col() or Crosstab.Row() returns the index of the column or the row for the current cell. Here, for example, you can set the background color of alternate rows thereby producing a zebra pattern. Example: Cond(Odd(Crosstab.Row()),LL.Color.LightGray,LL.Color.White)
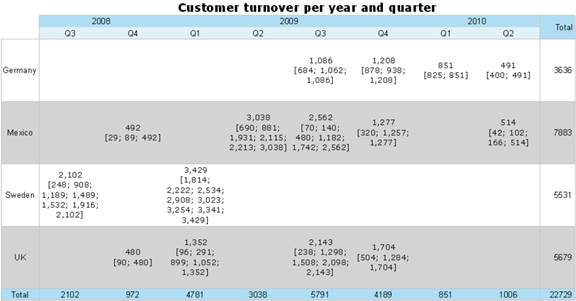
· Join$() returns a collection of strings, separated by a particular character. For example, you can output the individual turnover amounts in addition to the total turnover. Example:
Fstr$(Sum(Order_Details.Quantity*Order_Details.UnitPrice),-##,###,###) + ¶[+ Join$(Fstr$(Sum(Order_Details.Quantity*Order_Details.UnitPrice),-##,###,###))+]
· You can use Total() for calculations across all cells. Otherwise, calculations are always made across all values that affect the respective cell.