You use the Report Container object to add a table. As the name says, a report container can hold several objects.
Tables, charts, crosstabs and Gantt charts can be added in any order, even as sub-elements of tables. This lets you define sub-reports with almost any relationships between tables.
However, only one report container is permitted and you cannot define any separate tables, charts, crosstabs or Gantt charts.
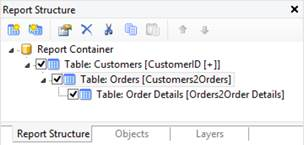
You define new elements in the Report Structure tool window along with the hierarchical structure that you want. All elements and respective sub-elements of a report structure are shown here, with object type and data source [relation name, sort name], in the order in which they will later be printed (sequence plan).
The currently selected item will be highlighted in the workspace. By using the checkboxes in the tool window Report Structure, you can toggle the visibility of elements, sub elements and branches.
All actions are available in a context menu. There are additional buttons in the top toolbar for the frequently used actions.
To add a new element to the report container, select the Append an element or the Append a sub-element button. Sub-elements are only possible with tables.
Only one element is displayed at any time in the workspace. This means that with the Report Structure toolbar, you select the element that you want to be displayed in the workspace.