Practice: Define the Report Structure Correctly
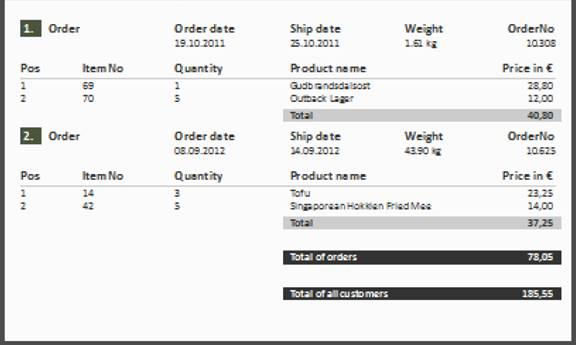
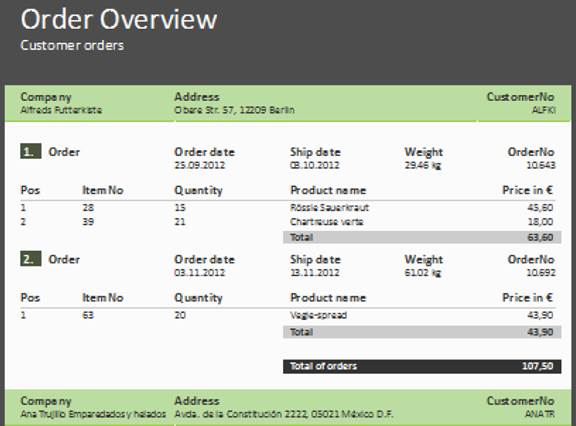
Let’s assume that you want to produce a list of all customers, showing the orders of the respective customers and all order items.
You want the result to look roughly like this:
To achieve this, proceed as follows:
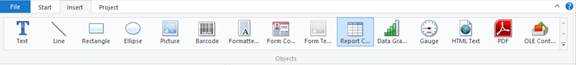
1. Click Insert > Report Container (Objects > Insert > Report Container).
2. In the workspace, hold down the left mouse button and pull the object to the required size.
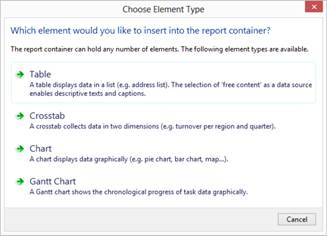
3. A selection dialog will appear for the chosen element type. Choose the Table element type.
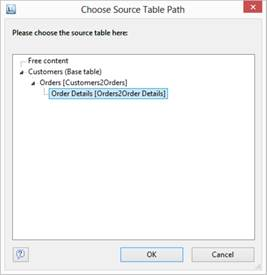
4. You specify the data source in the following dialog. All available tables are shown hierarchically, in other words, under the tables, you will find the relational tables in each case.
For the list of invoices, you need the following structure: Customers > Orders > Order_Details.
You have two alternative procedures at this point:
a. You select the Customers table to first create the top table. This corresponds to a top-down procedure; meaning that you then add the Orders sub-table followed by the Order details sub-table by means of the Report Structure tool window.
b. Or you choose the structure that you want right from the start by selecting the lowest table. This corresponds to a bottom-up procedure, meaning that you create all three tables starting by designing the lowest table.
5. You will be using the second method in this example. Accordingly, you select the table Customers > Orders > Order_Details.
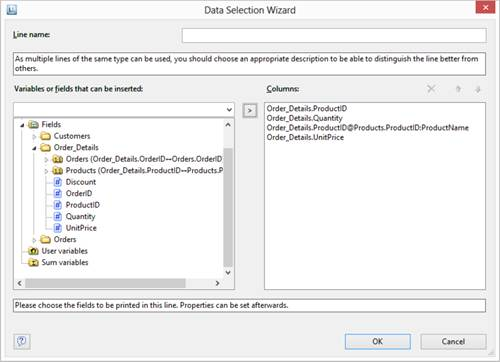
6. A selection wizard will appear with all the fields in the Order_Details table.
In this dialog, now choose the columns for this sub-table. For example, double-click the ProductID, Quantity, UnitPrice and ProductName fields from the Products table which has a 1:1 relationship. This will add the fields to the Columns area. You can change the order with the arrow button.
7. All tables will now be displayed in the workspace, the currently selected item Order_Details will be highlighted in the workspace.
· The selected fields are displayed in the data line, in other words, the data line contains the data.
· In addition, a header line is automatically produced. Header lines are used mostly as column titles, i.e., the selected field names are now shown here as text.
· The width of the columns adjusts automatically. You can adjust the width of a column manually by moving the separating line to the right or the left with the mouse.
Note: This changes all table columns whose separators are within +/-2 mm from the mouse position. If you hold down the CTRL key, the action will only be carried out for the line on which the mouse is positioned. The Column width modification affects next column option lets you alter the column width while making the next column smaller.
8. To define the columns of the Orders table, double-click the table in the Report Structure tool window.